The Myth of Oestrogen Deficiency
And why are we only just finding out why it’s not true!
When people say there is an “oestrogen deficiency” during perimenopause, they’re usually referring to large changes in estradiol levels as the ovaries age. The words low or deficient suggest significantly low levels with a fast decline. In reality, this doesn’t match what the best longitudinal data shows.
What actually happens?
This ‘deficient’ idea frames perimenopause as a hormone loss, when in reality, the biology tells a different story. In fact estradiol doesn’t behave that way in perimenopause at all.
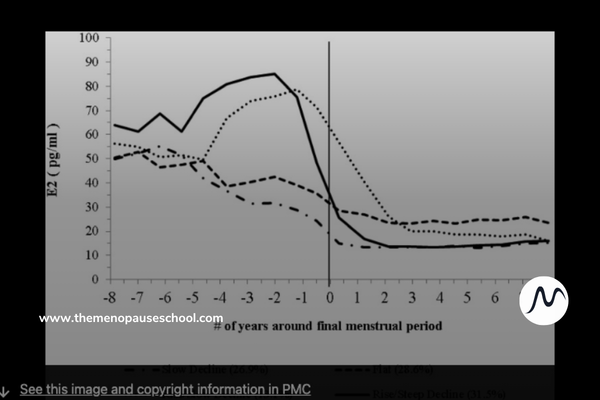
Instead, research from SWAN and other cohort studies shows that estradiol:
Often rises or becomes erratic before declining.
Has four trajectory patterns, not one universal drop.
So using “deficient” or “low” is inaccurate unless referring specifically to the late stage of the transition (within ~12 months of final menstrual period), and even then it depends on the individual trajectory.
The IMS Recommendations
On Tuesday 5th May 2026 the IMS presented their most recent recommendations on Diagnosis of Menopause including Stages of Reproductive Aging Workshop +10 in a live lecture. You can watch it here
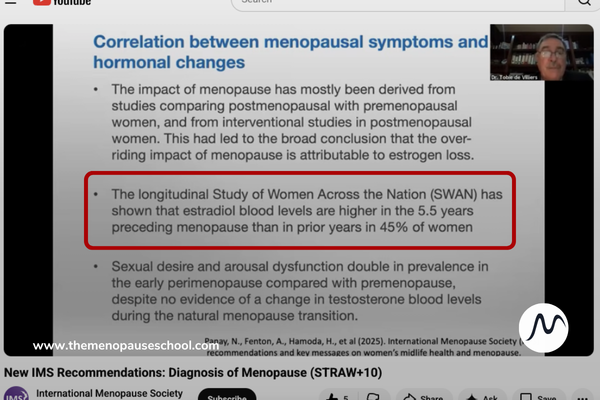
They now acknowledge that the terminology of oestrogen deficiency is wrong as menopausal symptoms are present when there is a oestrogen sufficiency.
📊 What does the data show?
The Study of Women's Health Across the Nation (SWAN) identified four estradiol patterns:
Rise–Early Decline (31.5%)
Rise–Late Decline (13.1%)
Flat (28.6%)
Low–Slow (26.9%)
Only one (Low–Slow) reflects a consistent downward trend from the start. The rest show initial rises, erratic peaks, or relatively stable patterns until close to menopause day. These patterns matter because symptoms often occur when levels are high or fluctuating, not low.

The information on the four trajectories was published in 2012. You can see it listed here on the SWAN website here on page 51, publication 416.
Read all 92 Citations here. The image above originates from here.
This work is quoted in a follow-up study called ‘Characterizing the trajectories of vasomotor symptoms across the menopausal transition’ - you can read it here
And also referred to in this review -
Menopause Transition and Cardiovascular Disease Risk: Implications for Timing of Early Prevention: A Scientific Statement From the American Heart Association. Here
And you will read about it on page 35 of The Menopause Manifesto, by Dr Jen Gunter, or here on her blog
It’s time to move past the myth. Perimenopause deserves better than a one-size-fits-all hormone story. The science has been here for over a decade. The question now is whether we’re finally ready to listen — and start talking about menopause the way it actually happens